

.png)
Direct household expenditures on energy—including electricity, gas and other heating fuels, amortized residential solar systems, and retail purchases of gasoline and public EV charging—are a key measure of energy affordability. To distinguish total expenditures across fuels from electricity bills and account for fuel-switching opportunities, we refer to this metric as a household's Energy Wallet.
In 2024, the U.S. average energy wallet spending was $5,530 per household, of which $1,850 was for utility electric bills. The largest component of the energy wallet was gasoline, which accounted for $2,930 per household. Energy expenditures vary significantly across households and regions, due to factors such as fuel prices, climate, household characteristics, and consumption patterns (Figure ES-1). In all states, average electricity bills represent less than half of the total energy wallet. See Appendix for data sources.
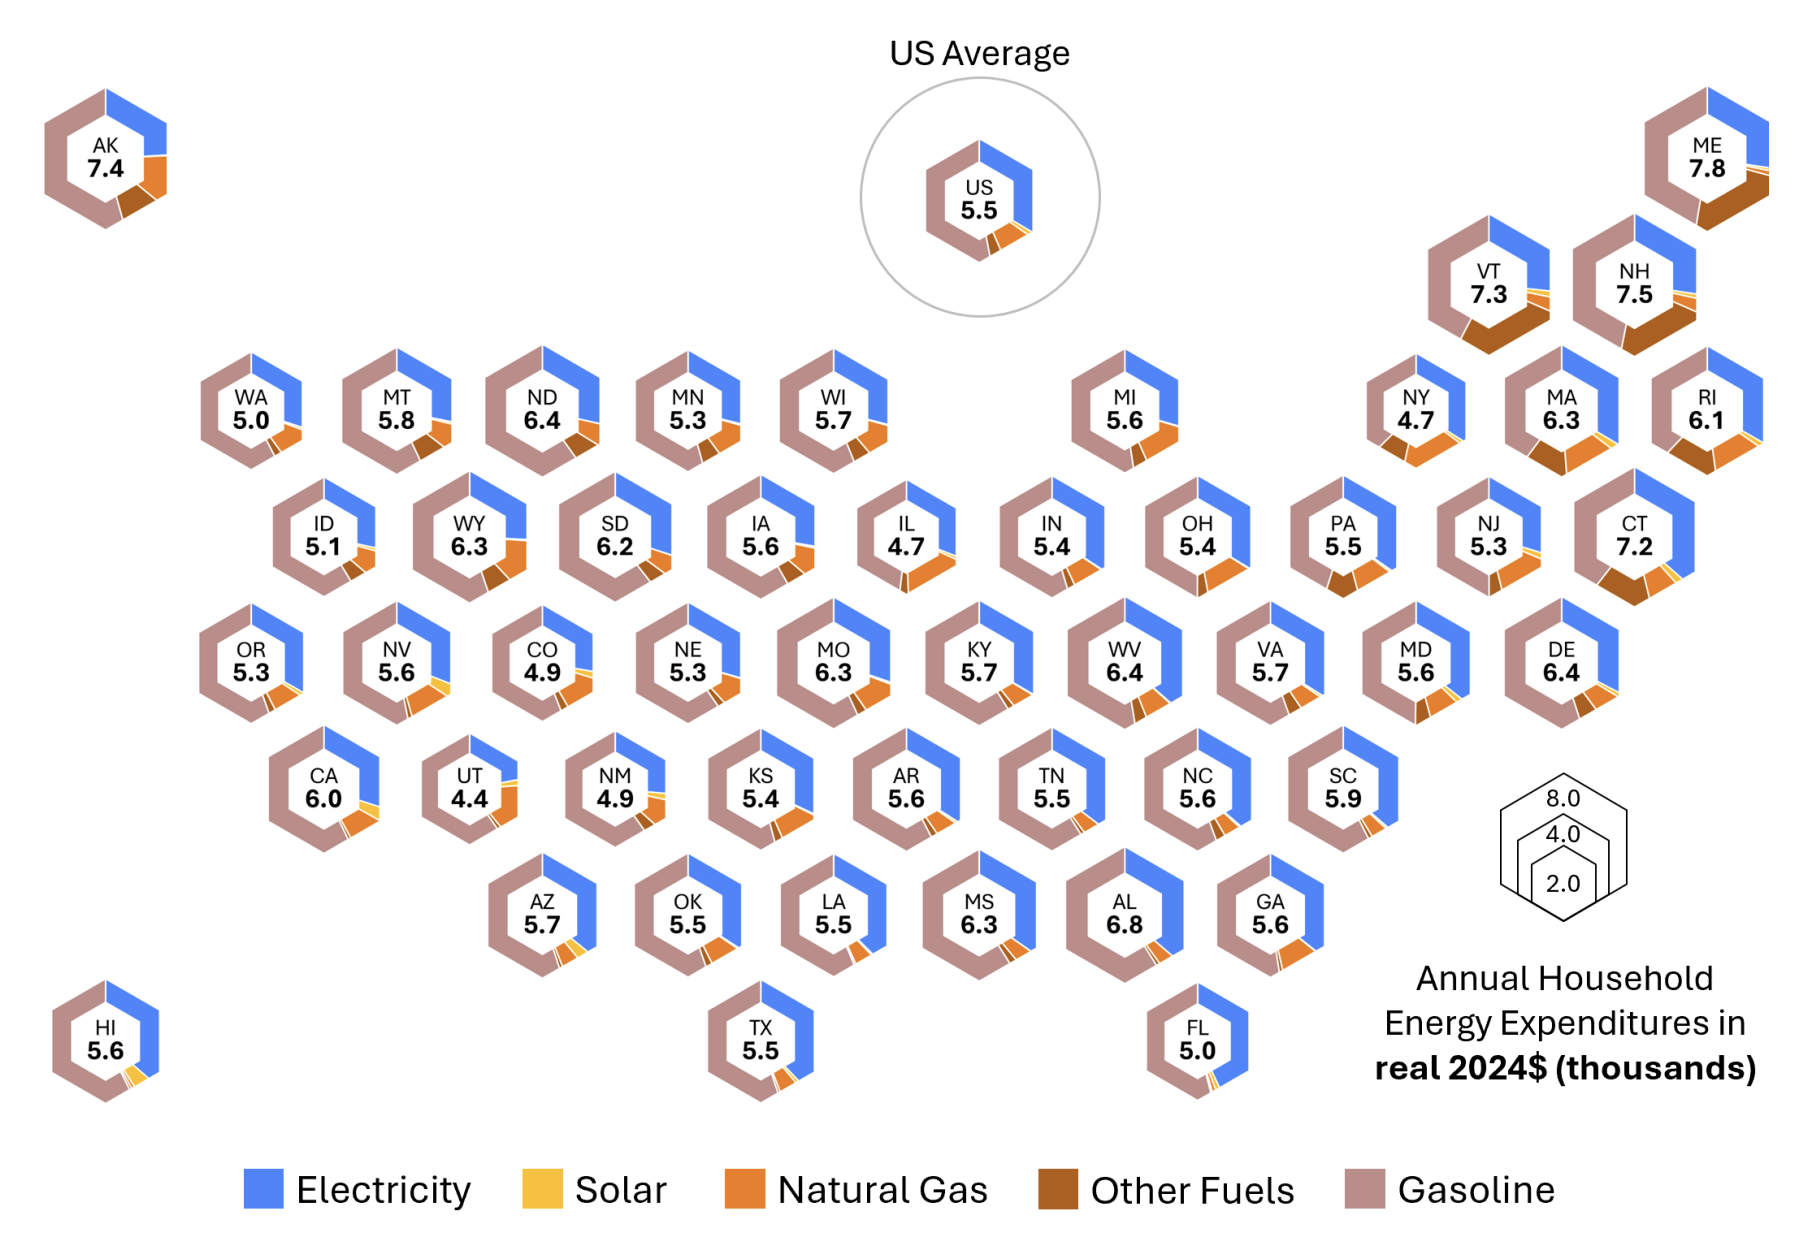
Figure ES-1. U.S. Energy Wallet: Break-out by State and Fuel in 2024
Adjusting for economy-wide inflation, the U.S. average energy wallet in 2024 was at a similar level per household as in 2000, around $5,350 (in 2024$). However, over that period it fluctuated between $4,590 (the 2020 pandemic) and $7,860 (a high point for fossil fuel prices in 2008). The electric bill component was steadier, ranging from roughly $1,600 to $2,000 (Figure ES-2).
Looking forward, future technological and structural changes, particularly electrification of light-duty vehicles, have the potential to reduce average household energy expenditures significantly. In a scenario projection using EPRI's US-REGEN model, assuming recent energy policy changes and economic adoption of new technologies, the U.S. average household energy wallet declines by 36% (in real terms) by 2050 (Figure ES-2). State-level average declines range from 10%–50%. This trend is driven primarily by replacing gasoline expenditures with increased spending on electricity as personal vehicles are electrified, which results in substantial net savings due to the efficiency advantages of electric vehicles. Efficiency and electrification of building end-uses also contribute to reduced household energy costs even as service demands increase in the future. We also consider a scenario with lower fuel prices and no phase-out of the Inflation Reduction Act (IRA) clean energy subsidies, which further reduces direct household expenditures, leading to a 42% decline in U.S. average energy wallet (in real terms).
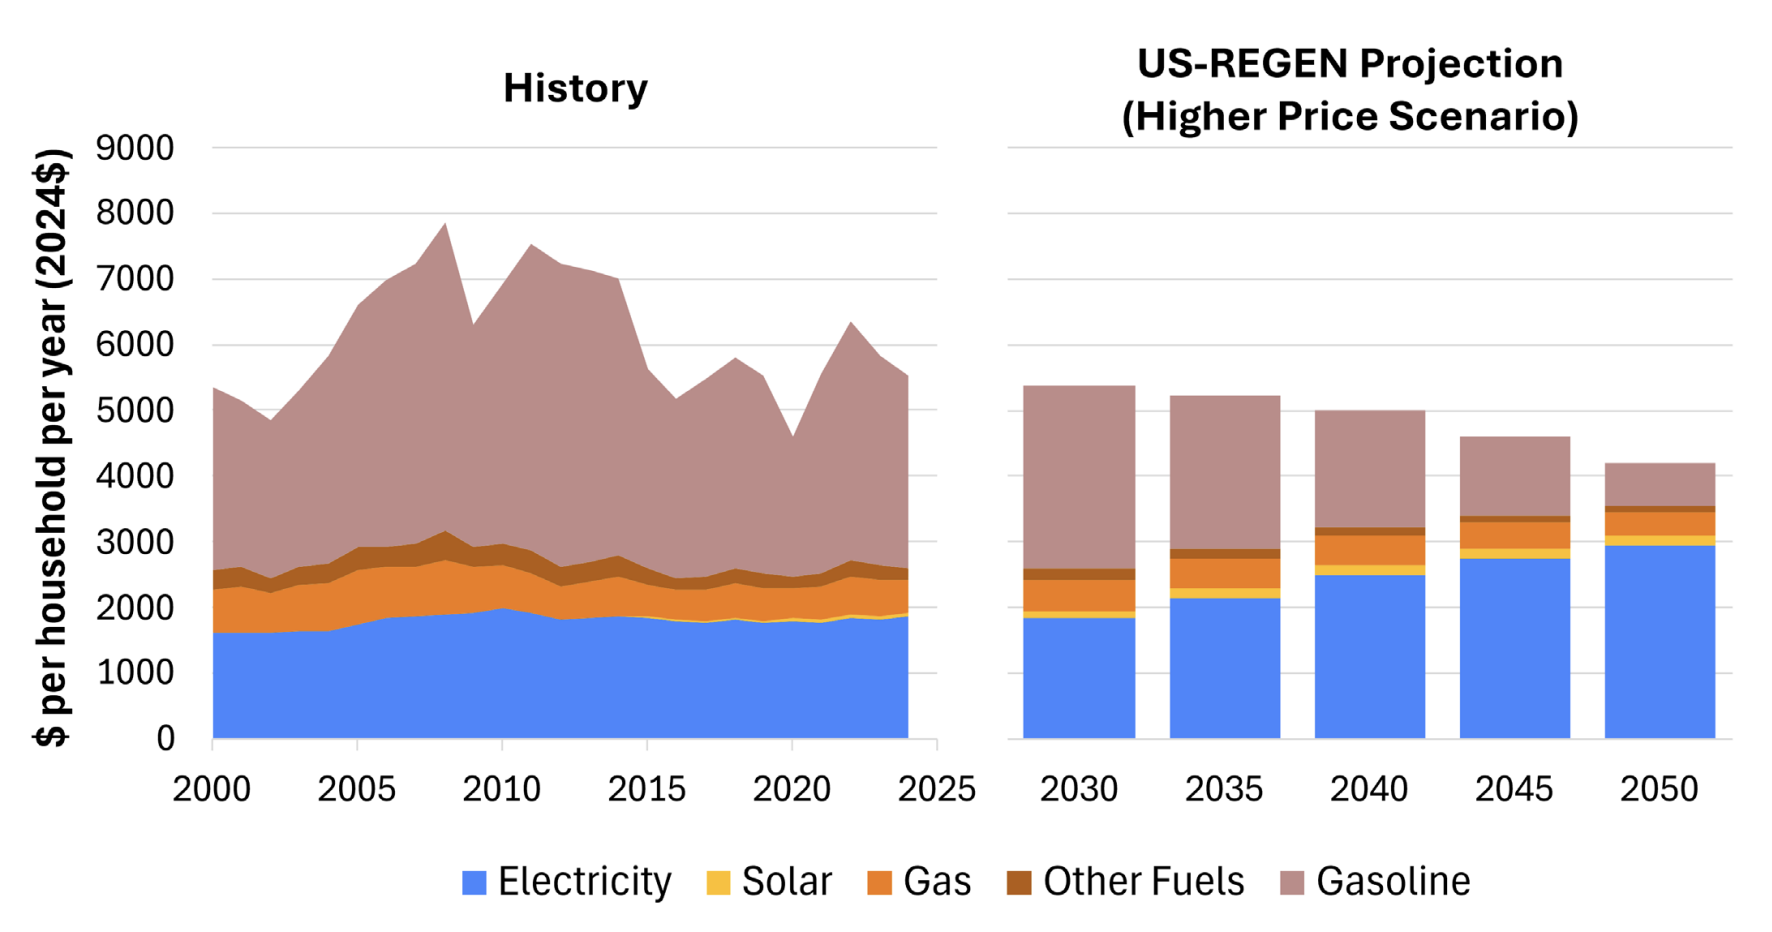
Figure ES-2. U.S. Energy Wallet: History and Projections in 2024
This report presents a straightforward calculation of the Energy Wallet metric describing total direct energy expenditures by households and how it evolves over time, in particular as a result of electrification trends. Additional follow-on analysis will leverage EPRI's modeling tools to explore electrification trade-offs and provide a more detailed accounting of non-energy costs of end-use technologies, both in aggregate and at the level of individual representative households; economy-wide energy service costs including non-household energy purchases (which are embedded in household purchases of many goods and services, such as air travel); and distributional implications of household energy costs for affordability.
Download the full report at: Link
Source: EPRI

Write a comment
Các trường bắt buộc được đánh dấu *