1. Market Overview (Market Outcomes)
Load Weighted Average Price
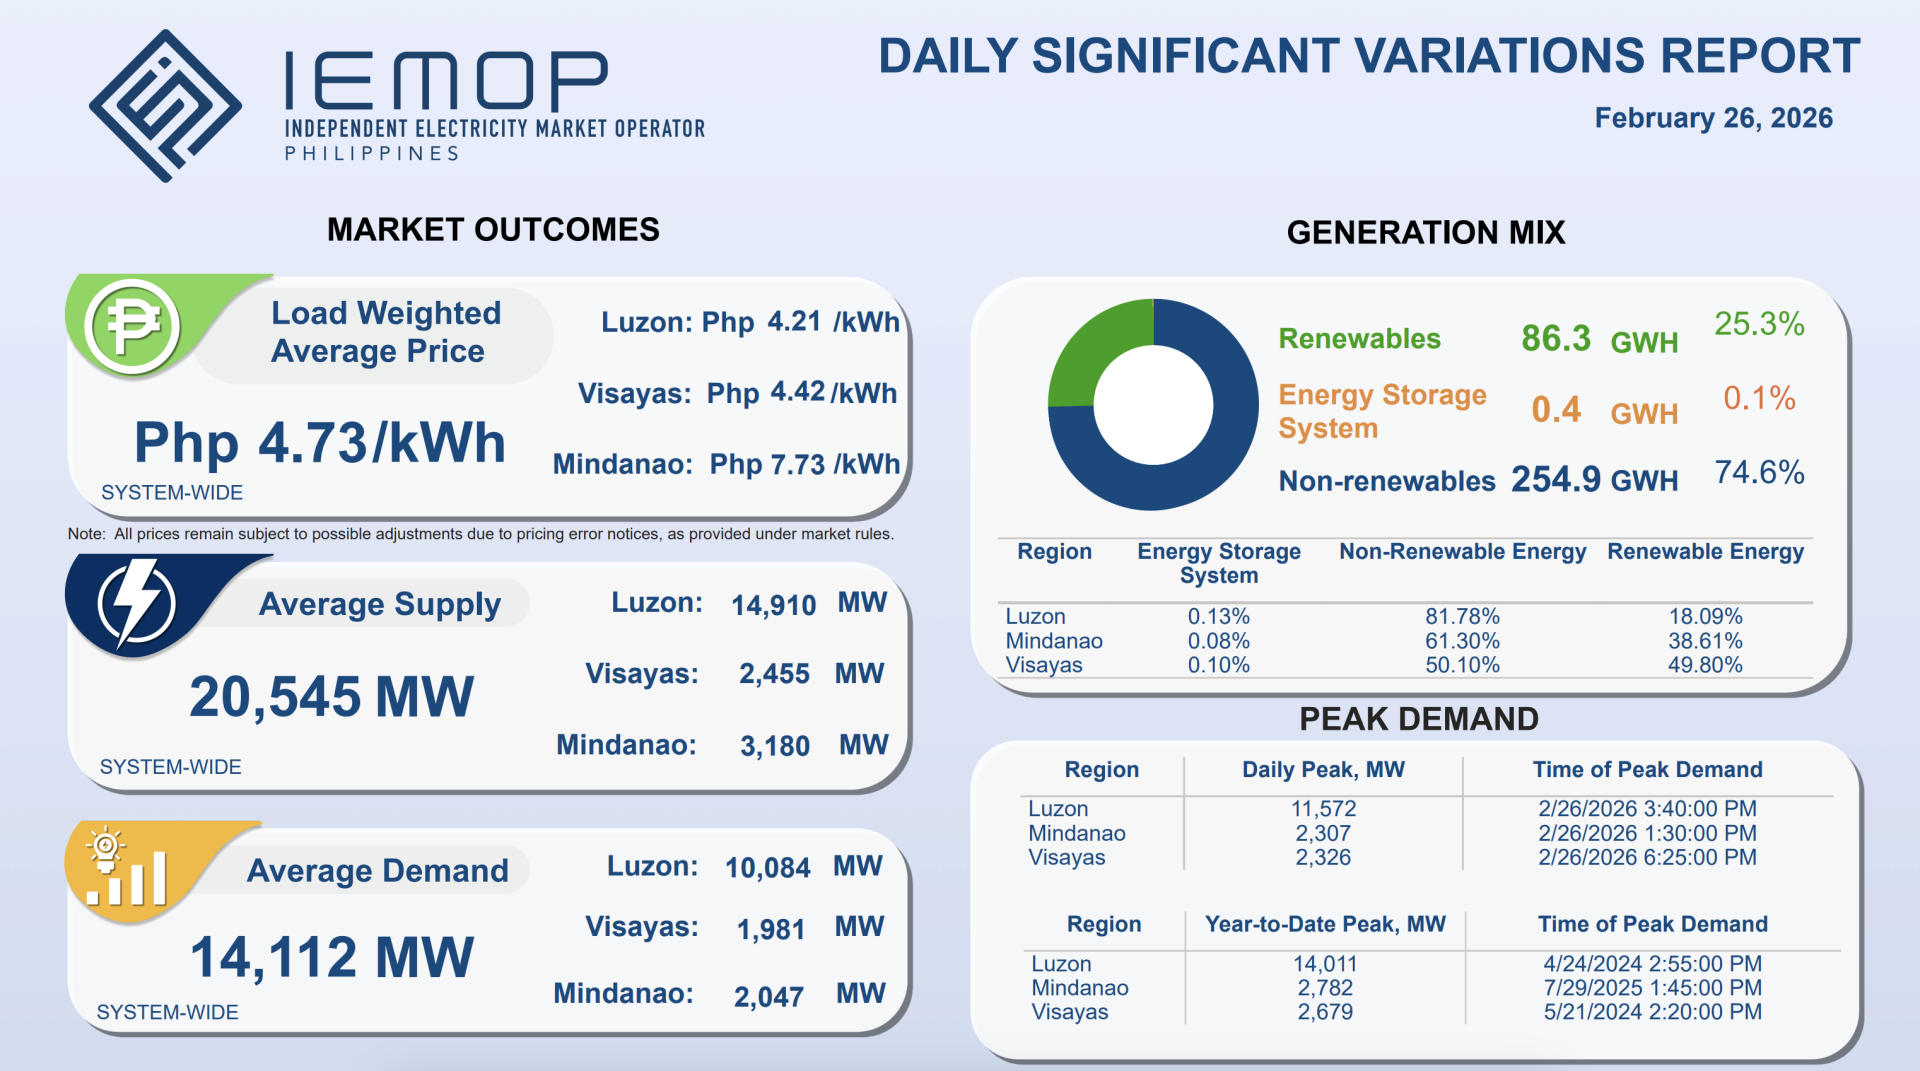
- System-wide: 4.73 Php/kWh
- Luzon: 4.21 Php/kWh
- Visayas: 4.42 Php/kWh
- Mindanao: 7.73 Php/kWh
➤ Analysis
- Mindanao records the highest price, nearly double that of Luzon, possibly due to:
+ Transmission constraints
+ Higher-cost generation (thermal/diesel)
+ Localized supply–demand tightness
- Luzon has the lowest price, reflecting a larger generation portfolio and stronger market competition.
Supply and Demand
- Average Supply: 20,545 MW
- Average Demand: 14,112 MW

➤ Observations
- The system reserve margin is relatively large (~6,400 MW).
- There are no signs of system-wide power shortage.
- However, high prices in Mindanao indicate localized imbalance rather than a nationwide shortage.
2. Generation Mix
Total daily generation:
- Non-renewables: 254.9 GWh (74.6%)
- Renewables: 86.3 GWh (25.3%)
- Energy Storage: 0.4 GWh (0.1%)
➤ Analysis
- The Philippine power system still relies heavily on thermal generation (~75%)
- The renewable share (~25%) is moderate.
- Energy storage systems (ESS) currently play a negligible role.
Theo vùng:
| Region | Non-Renewable Resouces | Renewable Resouces |
| Luzon | 81.78% | 18.09% |
| Mindanao | 61.30% | 38.61% |
| Visayas | 50.10% | 49.80% |
➤ Notable points:
- Visayas has nearly 50% renewable penetration, indicating strong energy transition progress.
- Mindanao has a relatively high renewable share (~39%) but also high prices, possibly due to transmission constraints or renewable intermittency.
- Luzon remains more dependent on thermal generation.
3. Peak Demand
Daily Peak
| Region | MW |
| Luzon | 11,572 |
| Mindanao | 2,307 |
| Visayas | 2,326 |
→ Peak demand occurred between approximately 13:00 and 18:25
Year-to-Date Peak
| Region | MW |
| Luzon | 14,011 |
| Mindanao | 2,782 |
| Visayas | 2,679 |
➤ Analysis
- Current demand has not yet reached the annual peak.
- The system retains operational headroom.
4. HVDC Power Flows (Interconnection)
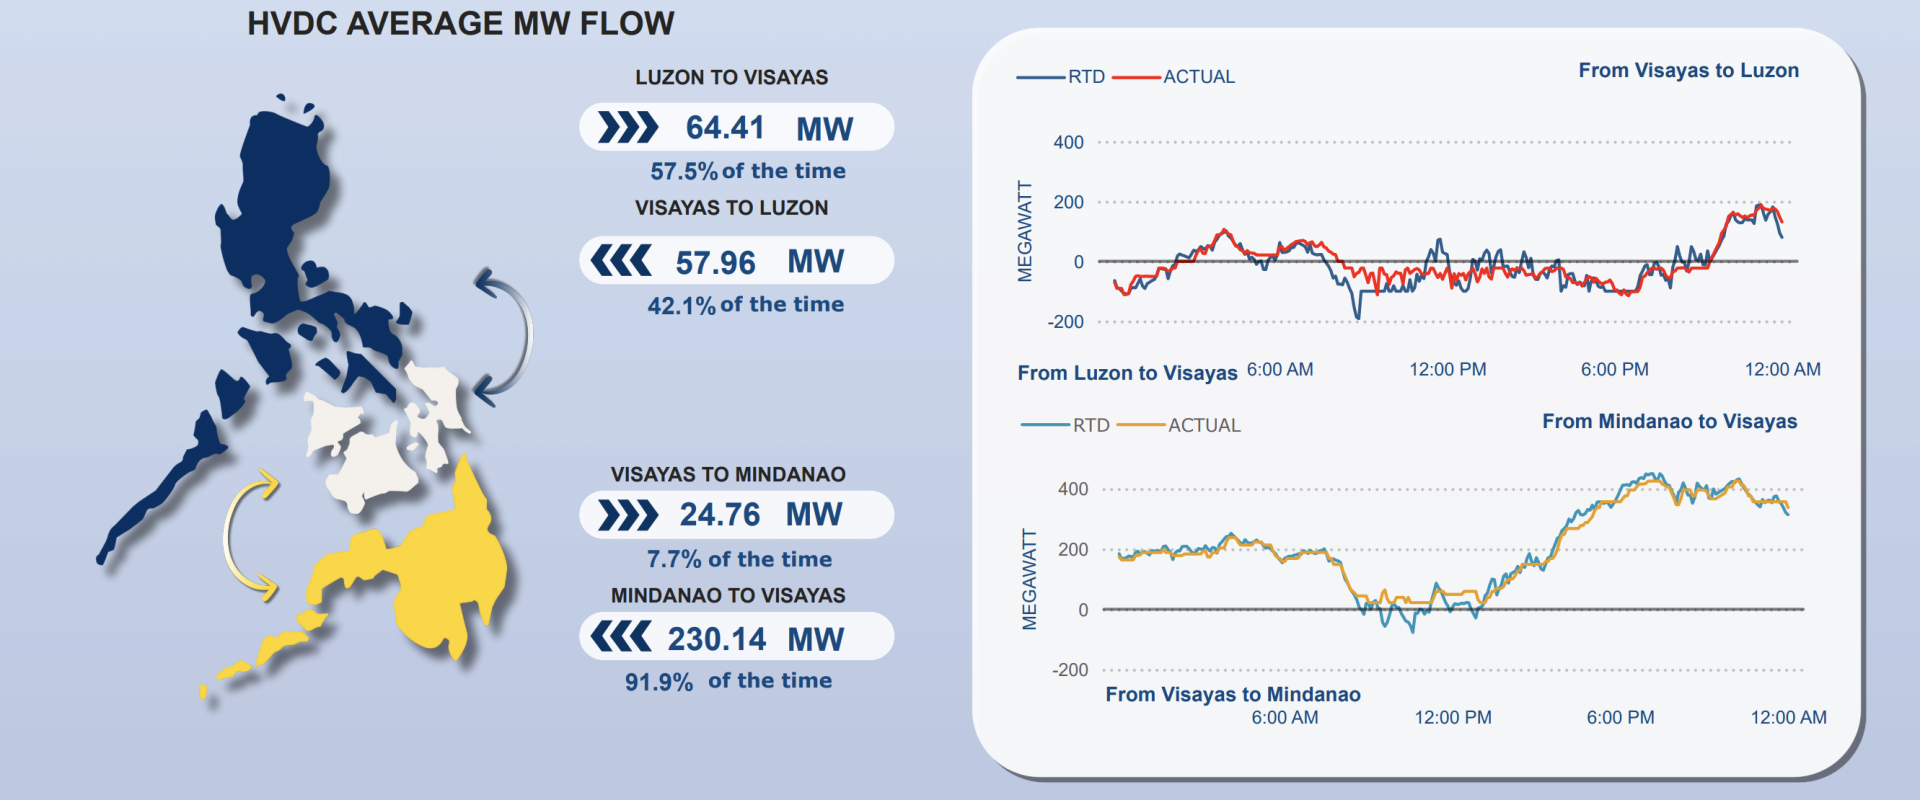
- Luzon ↔ Visayas
+ Luzon → Visayas: 64.41 MW (57.5% of the time)
+ Visayas → Luzon: 57.96 MW (42.1% of the time)
- Visayas ↔ Mindanao
+ Visayas → Mindanao: 24.76 MW
+ Mindanao → Visayas: 230.14 MW (91.9% of the time)
➤ Key insights
- Mindanao exports electricity to Visayas most of the time.
- However, Mindanao still experiences higher prices, possibly because:
+ Exports reduce available local supply
+ Zonal pricing separates regional markets
+ Internal transmission constraints exist
- The Philippine system operates as a multi-island grid, heavily dependent on HVDC interconnections.
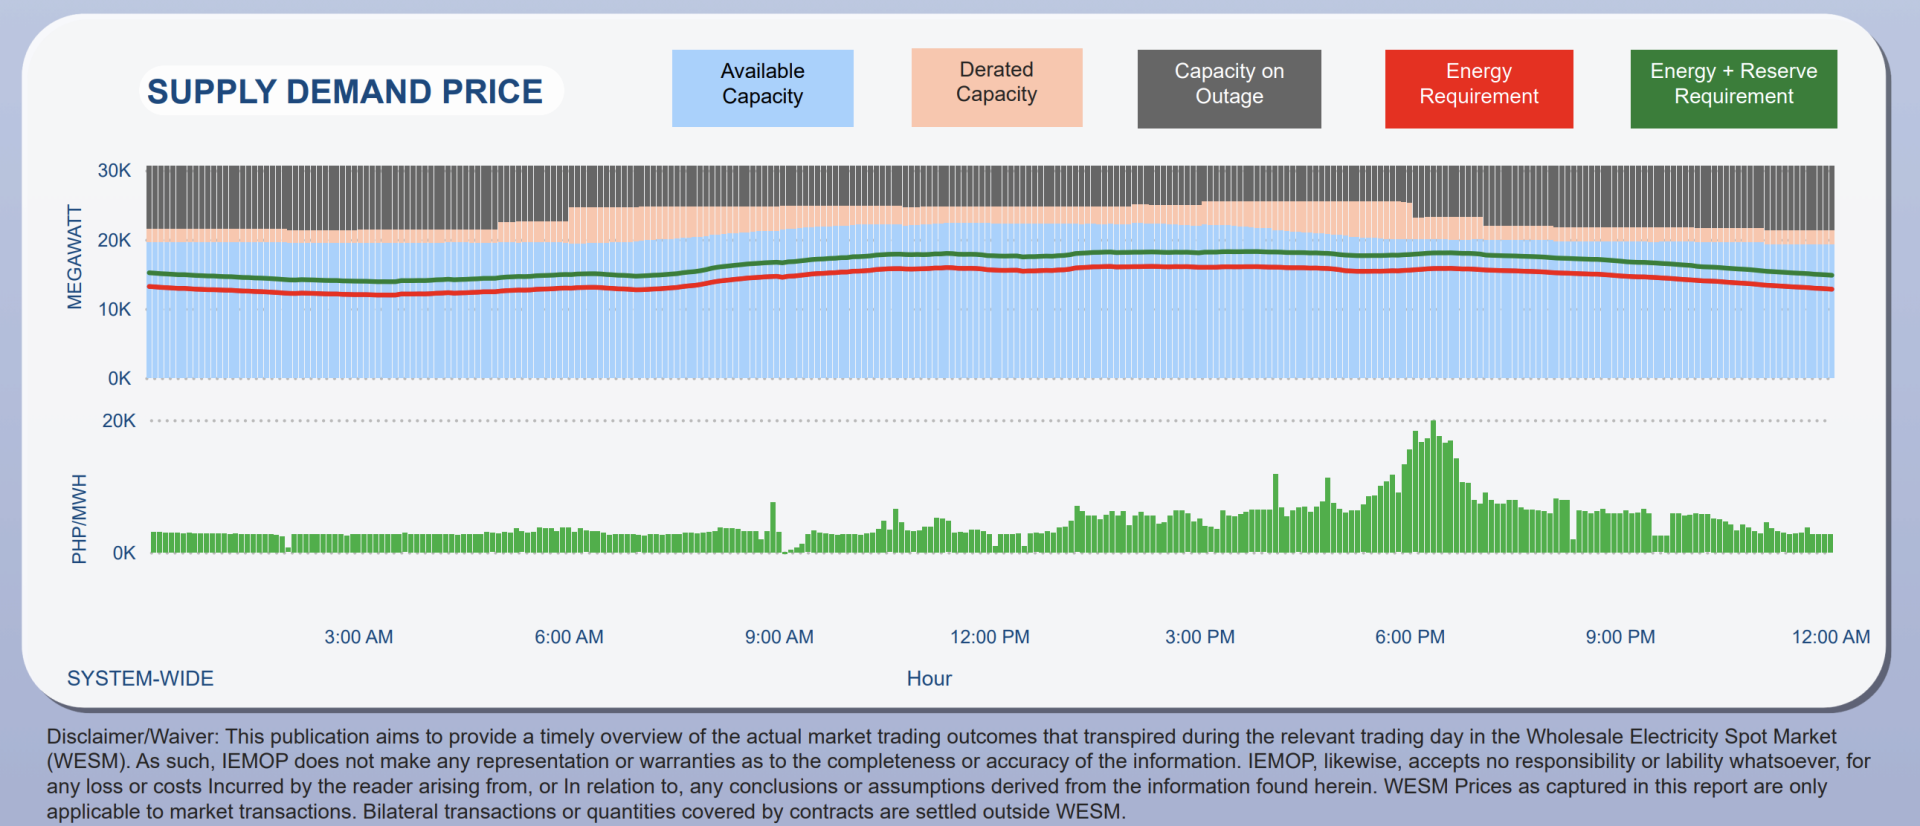
5. Supply – Demand – Price Chart
Observations:
- Capacity available cao hơn energy requirement
- A noticeable price spike appears around 18:00.
- In the early evening, demand increases while renewable output declines (solar sunset effect).
➤ This resembles the “duck curve” phenomenon:
- Lower prices during the day
- Higher prices in the evening
6. In-depth Assessment (Electricity Market Perspective)
Market Structure
- Philippines operates under:
+ Wholesale Electricity Spot Market (WESM)
+ Zonal pricing
+ Market-based dispatch
Key issues:
1. Price differentials across islands
2. Transmission constraints influencing prices
3. Increasing renewable penetration but insufficient ESS deployment
4. The critical role of interregional coordination mechanisms
7. Overall Conclusion
- There is no nationwide electricity shortage.
- Localized imbalances exist.
- The system remains heavily dependent on thermal generation.
- Renewables are increasing but lack sufficient flexibility support.
- Prices are volatile in the early evening.
- Inter-island transmission plays a decisive role in market outcomes.
Source: IEMOP
Write a comment
Các trường bắt buộc được đánh dấu *